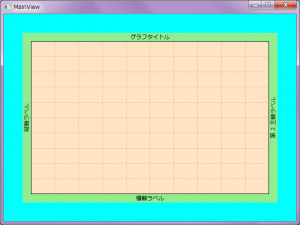
WPF でグラフ表示をするためのコントロールを自作したい.
WPF Toolkit とか使えばいいじゃんとかいうツッコミもあるかもしれないが,
結局自分の思うようなカスタマイズをするにはやっぱり自作しかない.
とりあえず折れ線グラフをターゲットとして考えているので,
カスタムコントロール名も LineGraph としています.
というわけで今回は LineGraph コントロールの構成のお話.
中見はほとんど空っぽだけど XAML で書くとこんな感じに考えています.
|
1 2 3 4 5 6 7 8 9 10 11 12 13 14 15 16 17 18 19 20 21 22 23 24 25 26 27 28 29 30 31 32 33 34 35 36 37 38 39 40 41 42 43 44 45 46 47 48 49 50 51 52 53 54 55 56 57 58 59 60 61 62 63 64 65 66 67 68 69 70 71 72 73 74 75 76 77 78 79 80 81 82 83 84 85 86 87 88 89 90 91 92 |
<ResourceDictionary xmlns="http://schemas.microsoft.com/winfx/2006/xaml/presentation" xmlns:x="http://schemas.microsoft.com/winfx/2006/xaml" xmlns:local="clr-namespace:CustomControls"> <Style TargetType="{x:Type local:LineGraph}"> <Setter Property="Template"> <Setter.Value> <ControlTemplate TargetType="{x:Type local:LineGraph}"> <Grid x:Name="MainContainerGrid" Background="{TemplateBinding Background}"> <Grid.RowDefinitions> <RowDefinition Height="Auto" /> <RowDefinition Height="*" /> <RowDefinition Height="Auto" /> <RowDefinition Height="Auto" /> </Grid.RowDefinitions> <Grid.ColumnDefinitions> <ColumnDefinition Width="Auto" /> <ColumnDefinition Width="Auto" /> <ColumnDefinition Width="*" /> <ColumnDefinition Width="Auto" /> <ColumnDefinition Width="Auto" /> </Grid.ColumnDefinitions> <!-- グラフタイトル --> <TextBlock x:Name="TitleTextBlock" Grid.Row="0" Grid.Column="0" Grid.ColumnSpan="5" Text="{TemplateBinding Title}" HorizontalAlignment="Center" /> <!-- 横軸ラベル --> <TextBlock x:Name="XLabelTextBlock" Grid.Row="3" Grid.Column="2" Text="{TemplateBinding XLabel}" HorizontalAlignment="Center" /> <!-- 縦軸ラベル --> <TextBlock x:Name="YLabelTextBlock" Grid.Row="1" Grid.Column="0" Text="{TemplateBinding YLabel}" VerticalAlignment="Center"> <TextBlock.LayoutTransform> <RotateTransform Angle="-90" /> </TextBlock.LayoutTransform> </TextBlock> <!-- 第 2 主軸ラベル --> <TextBlock x:Name="Y2LabelTextBlock" Grid.Row="1" Grid.Column="4" Text="{TemplateBinding Y2Label}" VerticalAlignment="Center" Visibility="{TemplateBinding IsY2AxisEnable}"> <TextBlock.LayoutTransform> <RotateTransform Angle="-90" /> </TextBlock.LayoutTransform> </TextBlock> <!-- 横軸目盛 --> <ItemsControl x:Name="XAxisItemsControl" Grid.Row="2" Grid.Column="2"> </ItemsControl> <!-- 縦軸目盛 --> <ItemsControl x:Name="YAxisItemsControl" Grid.Row="1" Grid.Column="1"> </ItemsControl> <!-- 第 2 主軸目盛 --> <ItemsControl x:Name="Y2AxisItemsControl" Grid.Row="1" Grid.Column="3"> </ItemsControl> <!-- データ --> <Grid Grid.Row="1" Grid.Column="2"> <!-- 境界線 --> <Border BorderBrush="{TemplateBinding BorderBrush}" BorderThickness="{TemplateBinding BorderThickness}" Background="{TemplateBinding GraphAreaBackground}" /> <Canvas x:Name="GraphCanvas"> <!-- 目盛線 --> <Path x:Name="GraphGridPath" Stroke="{TemplateBinding GridStroke}" StrokeThickness="{TemplateBinding GridStrokeThickness}" StrokeDashArray="{TemplateBinding GridStrokeDashArray}" /> </Canvas> <ItemsControl x:Name="GraphItemsControl"> <!-- データ線 --> <!-- データ点 --> </ItemsControl> </Grid> </Grid> </ControlTemplate> </Setter.Value> </Setter> </Style> </ResourceDictionary> |
まず,グラフタイトルと軸ラベルは単純に TextBlock を置いて,
依存関係プロパティを追加してバインドするようにします.
次に,軸目盛の数値は ItemsControl を利用して配置します.
ItemsSource には AxisItem という独自クラスのコレクションを指定しますが,
詳細はまた後日.
軸目盛のグリッド線も同じく ItemsControl で描画しようかとも思いましたが,
ここではひとつの Path オブジェクトで描画させます.
なのでグラフを表示する領域に Canvas を被せてそこに描画します.
データ点および点を結ぶ線については ItemsControl の中で記述できないかな~なんて考えています.
ちなみに MainWindow の XAML は下記のとおり.
|
1 2 3 4 5 6 7 8 9 10 11 12 13 14 15 16 17 18 19 20 21 22 23 24 25 26 27 28 29 30 |
<Window x:Class="CustomControlsSample.View.MainView" xmlns="http://schemas.microsoft.com/winfx/2006/xaml/presentation" xmlns:x="http://schemas.microsoft.com/winfx/2006/xaml" xmlns:vm="clr-namespace:CustomControlsSample.ViewModel" xmlns:custom="clr-namespace:CustomControls;assembly=CustomControls" Title="MainView" Height="480" Width="640" Background="Cyan"> <Window.DataContext> <vm:MainViewModel /> </Window.DataContext> <Grid Margin="40"> <custom:LineGraph Title="グラフタイトル" XLabel="横軸ラベル" YLabel="縦軸ラベル" Y2Label="第 2 主軸ラベル" IsY2AxisEnable="Visible" XAxis="{Binding XAxis}" YAxis="{Binding YAxis}" Y2Axis="{Binding YAxis}" BorderBrush="Black" BorderThickness="1" GraphAreaBackground="Bisque" Background="LightGreen" GridStroke="Red" GridStrokeThickness="0.5" GridStrokeDashArray="1,2" /> </Grid> </Window> |
LineGraph コントロールは Control から派生させて作成しています.
したがって,MainWindow.xaml の中の LineGraph コントロールに設定されているプロパティのうち,
BorderBrush/BorderThickness/Background 以外のプロパティは
すべて依存関係プロパティとして自分で追加したものになっています.
そろそろ長くなってきたので今回はこの辺で.
次回はグリッド線をどうやって描画しているのかを紹介しようかな.

